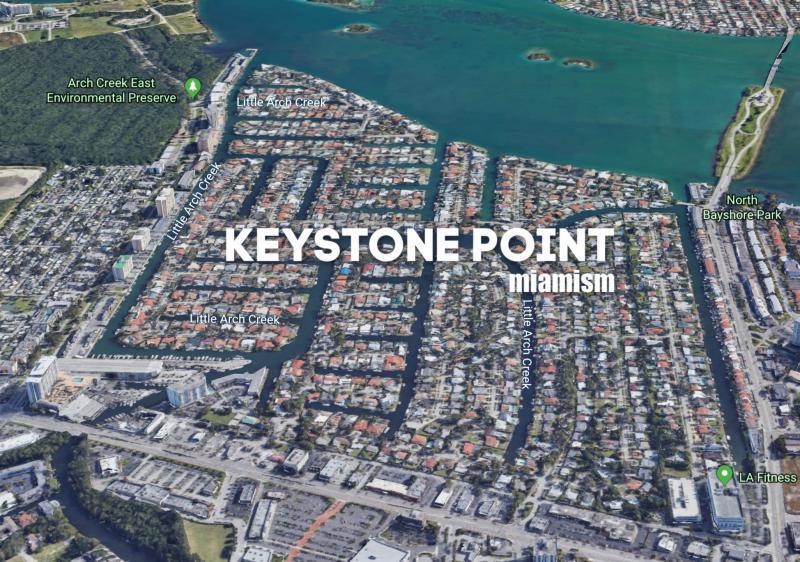
Keystone Point Real Estate Market Report – October 2019
How is the Keystone Point Real Estate Market Doing?
There are currently 50 Keystone Point homes for sale: (compared to 43 last month)
- Highest priced listing: $3,350,000 for the Keystone Island No. 2 home at 2360 Bayview Ln with 5 bedrooms / 5.5 bathrooms and 75′ of water frontage.
- Lowest priced listing: $499,999 for the non-waterfront fixer upper home at 2100 Alamanda Dr
- Pending Sales (properties under contract): 5
- Closed sales in October: 6 (compared to 2 last month)
- Median Sales Price in October: $1,057,500

The Keystone Point homes sold in October were the following:
- 1885 S Hibiscus Dr – updated non-waterfront home with 3 bedrooms / 3 bathrooms, 1,559 SF on 8,801 SF lot. Purchased for $475,000 in July of 2017, completely updated and listed for $725,000. Undergoing several price reductions and selling for $580,000 ($301/SF)
- 2090 Keystone Blvd – non-waterfront home with 3 bedrooms / 3 bathrooms, 1,895 SF on 10,345 SF lot. Originally listed for $790,000 in February, had a couple of contracts that fell through and closed for $675,000 ($361/SF)
- 12937 Banyan Rd – waterfront home with 4 bedrooms / 2 bathrooms, 2,093 SF on 8,664 SF lot and 76′ of water frontage. Listed for $875,000 in August and selling for $850,000 ($406/SF)
- 13105 Ortega Ln – updated waterfront home with 3 bedrooms / 2.5 bathrooms, 2,802 SF on 9,375 SF lot with 75′ of water frontage. Originally listed for $1,649,000 in May of 2019, had a couple of price reductions and closed for $1,265,000 ($451/SF)
- 2270 Bayview Ln – updated waterfront home with 5 bedrooms / 4 bathrooms, 3,063 SF on 9,375 SF lot with 75′ of water frontage. Originally listed for $1,749,000 in January of 2018, had a few price reductions and closed for $1,450,000 ($429/SF) **cash transaction
- 2391 Bayview Ln – 2007 new construction home with 6 bedrooms / 5 bathrooms, 7,051 SF on 13,134 SF lot with 174′ of water frontage. Originally listed for $3,999,500 in October of 2018, had a few price reductions and sold for $2,750,000 ($423/SF) **cash transaction
Keystone Point Price per Square Foot
The average sold price per square foot in Keystone Point, for homes on the water, in October was $427. The average price per square foot in the last 2 years has been:
- September’s average $259 (one sale)
- August’s average $394
- July’s average $479
- June’s average $465
- May’s average $397
- April’s average $370
- March’s average $434
- February’s average $395 (one sale)
- January’s average $421 (one sale)
- 2018’s average of $476
- 2017’s average of $421
Keystone Point’s Market Action Index went down to 26, which shows:
Slight Buyer’s Advantage
While prices have been at a plateau for a number of weeks, this is a Buyer’s market and the supply of homes listed has started growing relative to demand. This indicates that prices could easily resume a downward trend in conjunction with the MAI. Prices are unlikely to move significantly higher until there is a persistent upward shift in the MAI.
There are currently 17 months of inventory in Keystone with average day to close at over 250!! This means that as a seller, you need to have the right expectations and know that homes are taking almost a year to sell.

The price range that is moving the most right now is between $1-1.5 Million and that’s selling at an average of $419/SF. Knowing market micro-data is key to identify marketing factors for your home in order to maximize the value of your property. 35% of Keystone buyers pay cash and 75% of buyers occupy their homes and primary residences. Keystone continues to be one of our true local markets with buyers coming from The US and not foreign countries.

Take a look at our new reports with averages, absorption rates, per bedroom analysis and robust stats by CLICKING HERE.
If you want a no-obligation home value report for your property, please visit MiamismVALUE.com and we’ll be happy to send you a personalized report. Or you can simply call me, I do answer my phone (305) 206-9366.
To see our real-time market reports, please visit MiamismTrends.com or Click HERE