Miami Shores Real Estate Trends: May 2023 Market Analysis and Insights
We prepare a Miami Shores Real Estate market report on a monthly basis and publish it on the first week of each month, reflecting data from the previous month. Contact us if you would like to receive this directly in your inbox and can unsubscribe any time.
How is The Miami Shores Market Doing? Compared to a year ago?
There are currently 51 homes for sale: (compared to 38 a year ago in May)
- Highest priced listing is $7,770,000 for the new construction at 1275 NE 93 St with virtual replica NFT and own parcel of land in Social Business Lifestyle Metaverse of Alpha City – with 6 bedrooms / 6.5 bathrooms, 6,438 Sq.Ft. on 12,975 dry lot (non-waterfront) – listed at $1,207/Sq.Ft (and seller accepts ETH)
- Lowest priced listing is $695,000 for the 3 bedroom / 1 bathroom house at 108 NW 111th St ($508/Sq.Ft.)
- Pending Sales (properties under contract): 23 (compared to32 a year ago)
- Median Sales Price in May: $1,293,000 (compared to $1,385,000 a year ago)
- Closed sales in May: 16 (compared to 19 in May of 2022)
What is the average price per square foot in Miami Shores?
The average sold price per square foot in Miami Shores in May for homes not on the water was $662 compared to $649 a year ago. Previous averages as follows:
- April’s average $600
- March’s average $594
- February’s average $604
- January’s average $688
- 2022’s average of $589
- 2021’s average of $431
There were no waterfront homes sold in May of 2023 and average in May of 2022 was $1,471. Previous Miami Shores waterfront averages as follows:
- April’s average – no sales
- March’s average – no sales
- February’s average $652 (lake front – non-navigable)
- January’s average $534 (one sale – non-navigable)
Miami Shores Real Estate Micro-Stats
Feel free to download our complete market report for the last 12 months, showing micro-stats for Houses for Sale Miami Shores
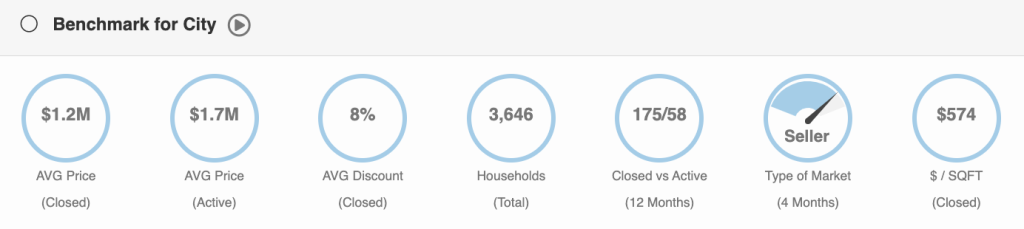
- Seller’s Market with 4 months of inventory
- Price-range moving the most is between $1-1.5 Million
- Average sold price is $1.2 Million
- 57.1% of all deals are CASH
- 89.7% of all buyers do so as primary residents (homestead and live in their homes)
- Buyers are not only domestic, but coming from Argentina, Venezuela, Colombia and Brazil.